|
BRHS /
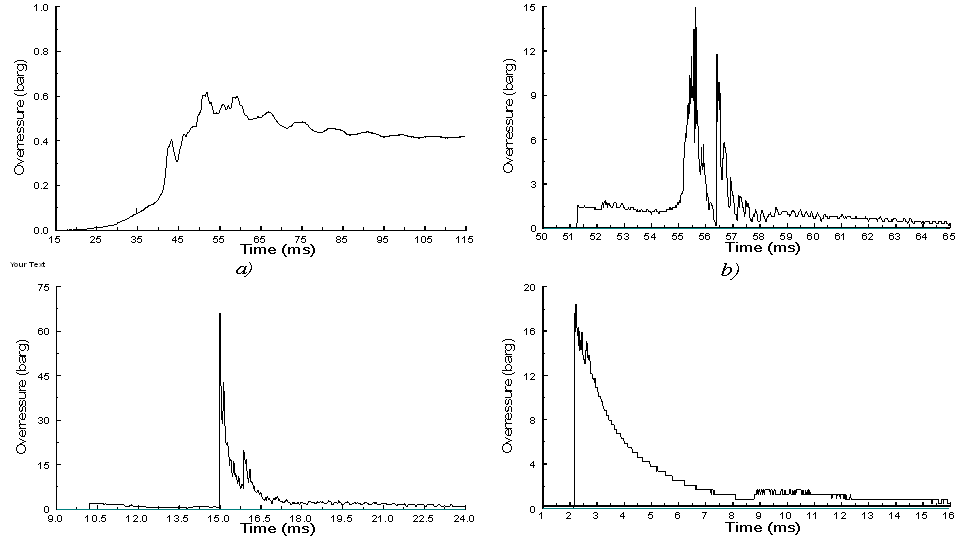
Deflagrations in Tubes and in a System of Connected VesselsDeflagrations in tubes, initiated by low energy sources, first propagate as slow deflagrations where the flame velocity relative to the tube is small (<< 30m/s). During this stage the gas flow displacements ahead of the exothermic flame or reaction front are relatively small, the pressure increase ahead of the flame is correspondingly low, less than one bar, and no shock wave is formed. As the flame front velocity and rates of energy release increase, due to increased rates of turbulent burning resulting from the interaction of the flowing gas with the tube walls, a shock wave is formed ahead of the flame front and the overall explosion process accelerates further. This acceleration is caused by the positive feedback between the combustion front and the gas flow ahead of the flame. The feedback arises via flow induced turbulence and subsequent increased turbulent mass burning rates. It is generally acknowledged, but not fully quantified, that further escalation of the explosion process can occur as the velocity of the shock-flame complex approaches ca. 1000 m/s. Localized explosions now develop, with significant transient overpressures in some cases. This is termed the deflagration to detonation transition or DDT phase. Following this transition the detonation wave moves faster than that predicted from simple steady state theory but is always decelerating and eventually reaches the steady or Chapman-Jouguet state. The various phases during an accelerating explosion event in a tube, initiated by a low energy ignition source, may therefore be categorized in general terms as follows:
Examples of pressure histories corresponding to each of these phases are shown in Figures 1 (a)-(d), obtained during flame acceleration tests. Explosion development in tubes i known to be a stochastic process and the pressure evolution is seldom repeated in multiple tests. However, Figure 1 does serve to illustrate the general forms of the pressures developed and their respective magnitudes. Figure 1(a) shows a slow deflagration which exhibits a gradual pressure rise with a maximum over pressure below 1 bar. Figure 1(b) is a pressure record from a fast deflagration test where a pre-cursor shock has formed. Figure 1(c) shows the pressure histories typical of an overdriven detonation immediately following a transition to detonation event. The peak pressures are several times greater than the pressures observed for a steady detonation wave, shown in Figure 1(d) (Teodorczyk&Thomas 2003). For a vessel of volume V which is connected to a large volume like the ports to the vacuum vessel, the peak pressure of deflagration can be evaluated by applying Fig. 2 (Iseli, 2001), which shows maximum values of deflagration pressures in a volume connected to a large volume containing non-burnable gas. The peak pressure depends on the connection length L, on the hydraulic diameter of the connection DH = 4A/(wetted perimeter) and on the specific vent connection area, which is defined by the vent area A divided by the vessel volume V2/3. This is derived from the cubic law of explosion intensity (pressure time gradient (Balthazar&Schodel 1983))). Balthasar W., Schodel J.P. (1983), Hydrogen Safety Manual, Commission of the European Communities, DG for Sience, Research and Development EUR 8396EN. |